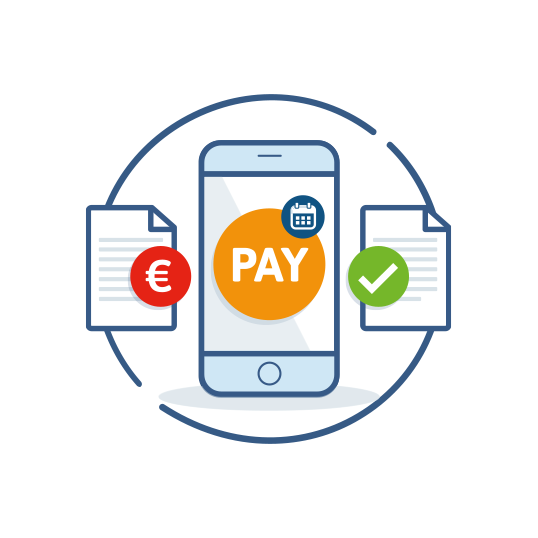
From enrolment to planning, communication and invoicing, the software of Flexkids supports all processes in the childcare sector. It provides a strong base for efficient, transparent and purposeful work.
Enrolling, digital signing, planning, invoicing, communicating and innovating. The Microsoft applications KidsVision support all processes in the childcare sector. With these applications you will invest in stability, increase the productivity and stay up-to-date with the latest developments.
Konnect is an extensive parent communication package with all the functionality you need in the childcare sector. It can be used for anything, from photos, to-and-fro-notebooks, cost summaries, applications and cancellations to news items.
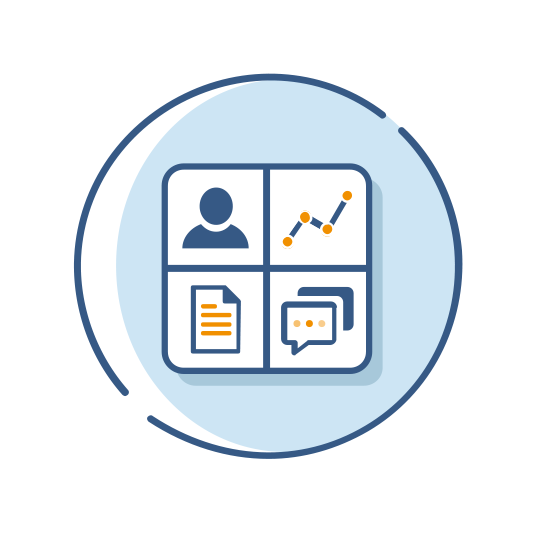
Portabase takes the difficult work off your hands. Using software you automate the processes which are important for your organisation. This gives you optimal insights and allows you to steer rapidly on real-time data.
DoenKids offers support and inspiration for creating development-oriented activity programmes. This is an excellent way both to connect to the children at your location and maintain a grip on quality.
The parent app of KidsKonnect offers a nice extra: Van Madelief. With this photo album module parents can, at the click of a button, create a photo album of all the beautiful moments of their child at the childcare location.
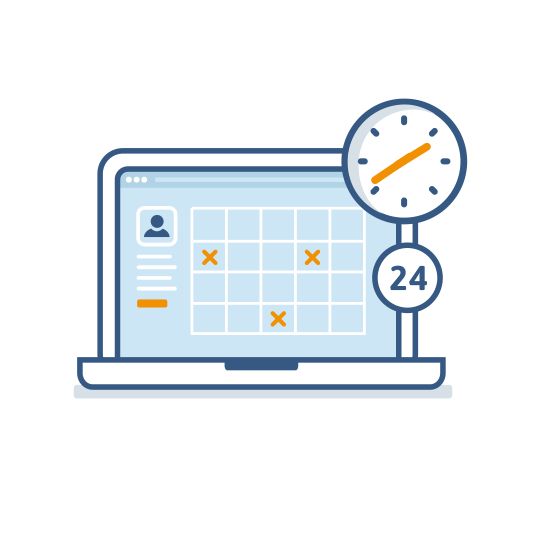
In the childcare sector your to-do list may sometimes seem endless. And then we haven’t even discussed the most important thing of all, which is to create a safe environment where children feel at home. With the software package of Deona you can continue to focus on that task.
From employees and managers to children and their parents, Social Schools brings them all together in advanced apps for the education sector. These apps are user-friendly and effective. This means they are not an extra administrative burden, but a valuable addition.
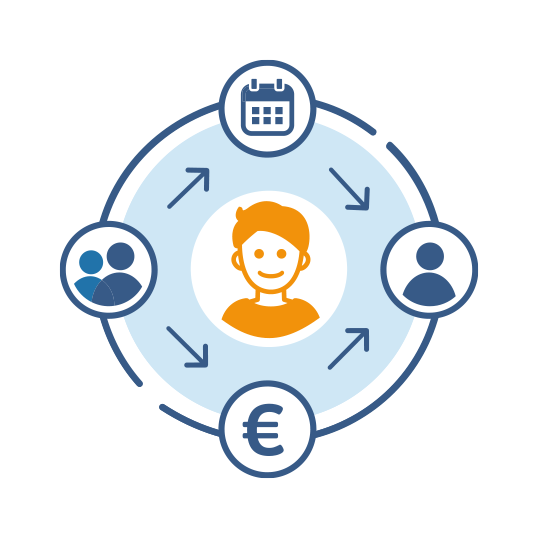
Jouw data is de voeding om jouw organisatie tot bloei te laten komen. Door razendsnel te plannen, begroten en forecasten excelleer je in een handomdraai. Met gebruiksvriendelijke software die je verder helpt wanneer jij dat wilt. Hoogste tijd om te oogsten met CPMLive.
VerbeterMeter is dé snelle en duidelijke tool voor ouder- en medewerkerstevredenheid in de kinderopvang. Met slechts enkele stappen breng je de tevredenheid van ouders en medewerkers in kaart. VerbeterMeter’s jarenlange specifieke ervaring binnen de kinderopvang zorgt ervoor dat er veel expertise en benchmark informatie beschikbaar is.
Bij Kinderopvang Academie geloven we in de kracht van duurzame ontwikkeling (of: permanente educatie) van pedagogische kennis en vaardigheden. Onze missie is om kinderopvangorganisaties te ondersteunen met hoogwaardige online opleidings- en coachingsfaciliteiten, zodat professionals kinderen optimaal kunnen begeleiden bij hun ontwikkeling.